Posted February 2, 2009
|
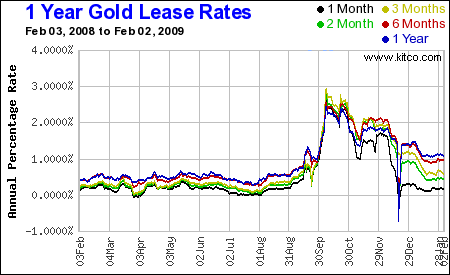
Watch the gold lease rates, and silver lease
rates, which have each more than tripled in the last two months. It means that vault owners who control
large quantities of gold are much less willing to permit other parties
to borrow it, plain and simple. |
Lease rates precede price
movement.
Bullion bankers, including central banks, are reluctant to lease their
physical supply. The lease game is
thoroughly perverse. One effect rarely noted is that short sellers within
the futures contracts might be squeezed due to leasing challenges. If they
have a harder time to roll over contracts, by means of higher required
posted margin or higher cost of leased gold, then they must cover. A price
rally ensues.
note:
The reality behind Gold lease is that
Gold that has been leased out by a central bank will NEVER be returned. It
was sold by the leaser. Hence, leasing Gold ends up to be exactly the same
as selling Gold.
Posted December 27, 2008

Click on the chart
Dec 27 - The
£
chart shows similarities with Argentina
As of August 4, $-Gold and most gold indexes
have disregarded their previous breakout signals. Contrary to my belief, $-Gold and
$-Silver have fallen back all the way to their Support levels.
This is an example
that markets sometimes can behave in a irrational way. The Secular Bull trend is
still intact and we are probably just seeing another higher low. There is no
doubt that we shall see a level of $ 1,000 to $ 1,200 by the end of this year.
Just that the actual happenings could delay it for some weeks...too early to
call.
If you're really in doubt about Gold, check the information and charts under
Subprime CDO.
It
is
is really scary!
Posted December 2008
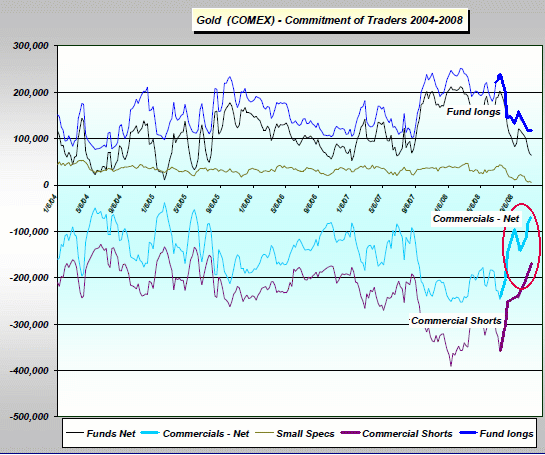
Commercial shorts keep on falling and
small investors become negative. An
excellent sign!
Posted November 19, 2008
“Time is more important than price; when time is up
price will reverse. (W. Gann)”
-
Gold bullion broke out above a 4 year old high of
$192.00 in February 1978. Ten months later in November 1978 gold bullion went
below the breakout point of $192.00. Two months later gold made a new high at
$258.00. That was followed by a corrective low in April 1979 that bottomed at
$231.80. Nine months later, in the month of January 1980, gold bullion reached a
high of $850.00.
-
Gold bullion broke out above a 28 year old high
of $850.00 in the month of January 2008. This was 30 years after gold broke out
to a new high in February 1978. Ten months later, in this month, October 2008,
gold appears to have bottomed below the 28 year old high of $850.00. This is 30
years after gold bullion bottomed below the breakout level in the month of
November 1978. If this 30 year pattern is to continue there must be a move to a
new high for gold in December 2008. We had a new high in for Gold expressed in
many currencies. Only the price of Gold expressed in Dollar is still 25%
lower...
-
November 19 - Putting it all
together –
falling volume, falling prices, and falling open interest - means that the
market is running out of traders willing to keep the trend going. There is a
high probability that the downtrend is coming to an end.
click on the chart for the reversal
formation - dec. 11- jan 8
Updated November 18, 2008 -
Ratio Gold versus the Philadelphia Goldmines index.
The ratio is in an absolute BUY mode!
Updated
November 4, 2008 -
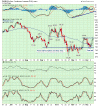
RSI (Relative Strength
Indicator) and (full) Stochastics
weekly Nov. 4 - monthly Nov. 4
RSI (Relative Strength
Indicator) and (full) Stochastics can be excellent trend reversal
spotters. However, one must take into account that the RSI or Relative Strength
Index must be interpreted in a different way depending upon the cycle. In other
words, in a SECULAR BULL market, the RSI will seldom breaks below the 50 level. In a SECULAR BEAR MARKET, the RSI will seldom
break above the 50 level. In other words, a RSI below the 50 level in a Bull
Market is a Buy signal and a RSI above the 50 level in a Bear Market is a Sell
signal. Stochastics show similar characteristics. The weekly fast
stochastic shows an bottom is imminent. Note that Gold indicators remain in
their Buy zone.
Updated
October 15, 2008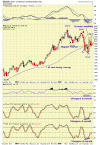 -
Moving Averages and MACD applied to Gold.
The
65 Week Moving average is an excellent indicator for the long term trend
of Gold. During a Secular Bull Market, the price normally stays
ABOVE its 65 week moving average. Hence, each correction towards this moving
average is to be seen as a Buy opportunity.
The Moving Average
Convergence/Divergence (MACD) is one of the simplest and most reliable
indicators available. MACD uses moving averages, which are lagging indicators,
to include some trend-following characteristics. These lagging indicators are
turned into a momentum oscillator by subtracting the longer moving average from
the shorter moving average. MACD
centerline crossovers occur when the faster moving average crosses the slower
moving average and hereby generate a sell or a buy signal.
Divergences between the price evolution and
the RSI, Slow and Fast Stochastics are also important additional indicators.
October 15, 2008 the charts show are positive divergences.
Updated
October 3, 2008 -
Long Term Charting applied to €-Gold.

October 3rd, 2008 the BEAR TRAP has been confirmed!
Long Term Charting applied to Gold is
explained with a chart of Gold expressed in Euro. This chart is different to
the one expressed in Dollars because its falling exchange rate against the
Euro.
Technically, once Gold or a Share brakes
out of a consolidation, it has to retest this level. In other words, the
last consolidation/resistance for Gold was € 550 / € 560; Gold broke through this
level and rose to € 650 some months ago. Since it has been coming down and
has successfully retested this level. Resistance has become support. LONG
TERM € Gold has fallen back to its 1980 top and also tested it (the Good-bye
kiss). Hence the 1980 top resistance has now also become a support
level. As of August 15, this support has been broken and €gold has even
penetrated its secular uptrend.
Updated September 18,
2008 -
French Curves like Gold.

French Curves like Gold. A French curve is a mathematical
formula that works rather well on Gold and currencies. It acts as a long
term support line and at the same time it shows the (potential) acceleration.
A penetration of the French curve would light up a caution sign. During the
month of August, the French curve has been penetrated! The caution
sign has been turned 'ON'. The odds are however that we may have
seen a BEAR TRAP.
Updated September 16, 2008
Little can be added to markets which
speak for themselves. This is the LAST time in our lives we are to see these
price levels for Gold. For those who are still in disbelief, write it on the
wall and
remember it in some months from now.

Posted September 10, 2008
-
Fishing for a bottom ranges from difficult to impossible...but Gold starts to
slide too much...too fast..
-
Gold broke through the $ 840 and $
780 levels and is now steady at $ 760. Do not panic if you see a level of $
750 to $ 730. This will probably be the last leg down. At this level, Gold
will run into really heavy resistance (like the Dollar is running in right
now). With the nationalization of Fannie and Freddie and the problems of
Lehman and other financials, fundamentals keep on moving into favor of Gold
and Silver.
- Open interest shows a HUGE
amount of investors going SHORT on gold.
The monetary authorities have accomplished exactly that they intended to do:
now the bullion banks can move to the long side of the market in Gold,
Silver and shares and position themselves for what they all know is coming.
As for the Dollar, the action shows the panic. Once the last buyer moves in,
the price promptly collapses.
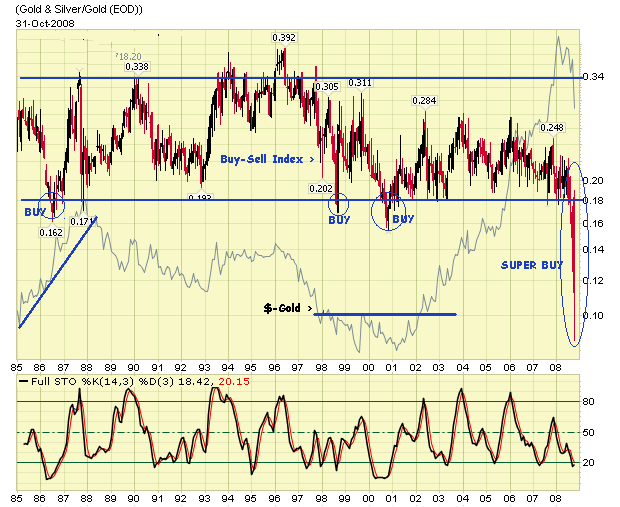
-
Gold is still in the strongest Buy
mode since
1984!
This doesn't mean prices will
reverse 'tomorrow'. History shows this can take several weeks. Bottom fishing is
an extremely difficult exercise.
Posted August, 2008
The 12 Moon cycles
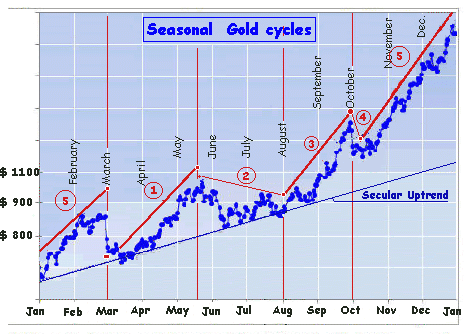
Each year Gold forms what I call the
12 Moon Waves. The 12 Moon cycle starts traditionally somewhere in the 1st
Quarter of the year and lasts until late spring. It is followed by what I call
the Summer doldrums. August-September, Gold wakes up and starts its 1st Autumn
up leg. October sees a short correction before the last and strongest upswing
starts that runs all the way into the new year.
> back to Gold fundamentals
Goldonomic, Florida, USA -
 +1
(772)-905-2491
|