|
Updated July 25, 2009
Not a
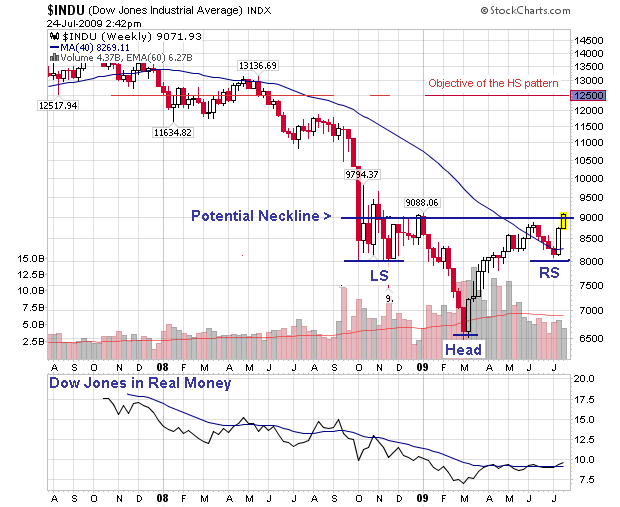
single analyst mentioning the Reversed Head and Shoulders patterns we have for
many stock market indexes and a lot of equities. Analysts are so biased they
only see Negative chart formations and forget markets ALWAYS climb a wall of
worry.
Over the past
months Authorities have flooded the financial markets with trillions of freshly
created fiat money. Whatever is said, Communicating financial vessels play a
major role in today's financial markets and under these conditions a Dow Jones
of 30,000 and higher is very plausible. Zimbabwe is a modern example of the
potential many stock market indexes have. During the hyperinflation cycle, the
Zim stock market index literally exploded in the hundred thousands. The bad part
however is that these dramatic upswings are positive only when expressed in
Nominal Terms or in Fiat Money. In other words, the rise is and will be the
result of inflation and in particular of hyperinflation. Expressed in Real Money
or barbaric Gold, the end result is negative.
Not only have
financial markets been flooded with fresh fiat money but today Fund managers sit
with another huge dilemma. The liquidities they have acquired during the last
months of 2008 and the 1st Quarter of 2009 are still idling on the
sidelines and in most cases the managers have no option but to reinvest these
before year end.
As we have real
negative interest rates. Cash and Money market funds yield zero to
negative. Bonds are over their parabolic top and are down by 10% since
the beginning of this year. Looking at the artificially low interest rates, one
had to be an idiot to buy any. The Real Estate markets are clearly in a
long term bear market and Commercial real estate has joined the slide by
loosing 35% since its top in 2007. Add to this a negative business climate where
stocks are liquidated for cash because entrepreneurs fear what is coming and it
becomes easy to understand that even under deteriorating business conditions
communicating financial vessels may well end up pushing up stock markets to
unrealistic high levels.
Theoretically a
head and Shoulders pattern is a REVERSAL pattern (exceptions occur). The
formation is only completed once the neckline is broken and tested. The Dow
Jones Industrial Index has to break through the 9,000 and test this level
before the reversal is confirmed. [Important is that an aborted HS pattern will
dramatically swing in the opposite direction]. Assuming the index breaks the
neckline [we think it will], the objective of the Head and Shoulder pattern is
12,500. If it fails, we’ll slide back to 6,500.
Today Short term
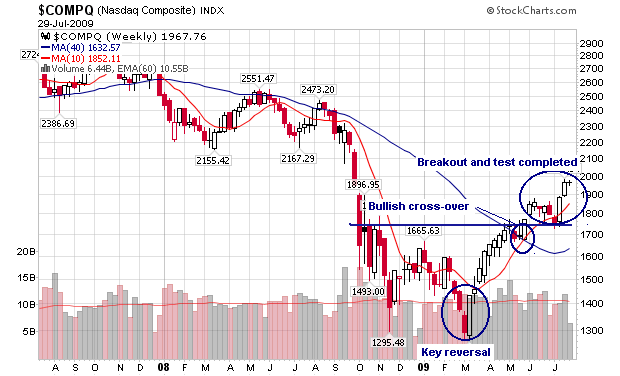
indicators are overbought. But we have bullish cross-over of the 50 and 200 day
Moving Averages of a bunch of stock markets and stocks. Bullish
cross-overs are reliable technical indicators and they will certainly help
markets to climb their walls of worry.
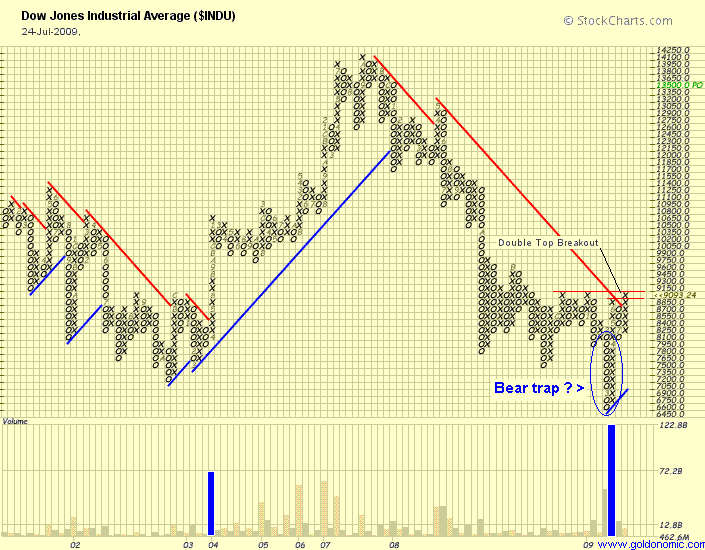
The Dow Jones
made a bottom in March of this year with a volume which was almost double of the
volume of the 2002-03 bottoms. Add a false down break which could end up as a
huge bear trap and we have another confirmation of a potential reversal instead
of yet another huge down leg as many analysts predict.
Having said this,
if the Dow Jones breaks and tests the 9,000 level we have a technical reversal
which could take the Index to historic levels in nominal terms. During this
upleg, we expect Gold and Silver shares to lead the market together with Oil and
Gas stocks. The implications of this reasoning is that Gold, Silver, Oil and the
mines and Oil shares will probably rise in a dramatic way in order to make up
for the (Hyper)inflation and nominal rising stock markets.
Francis D. Schutte - July
23, 2009
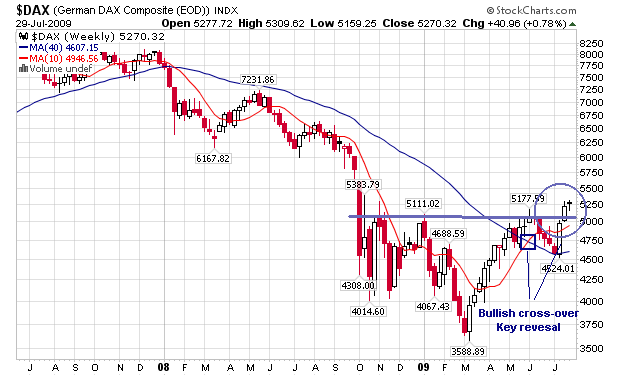
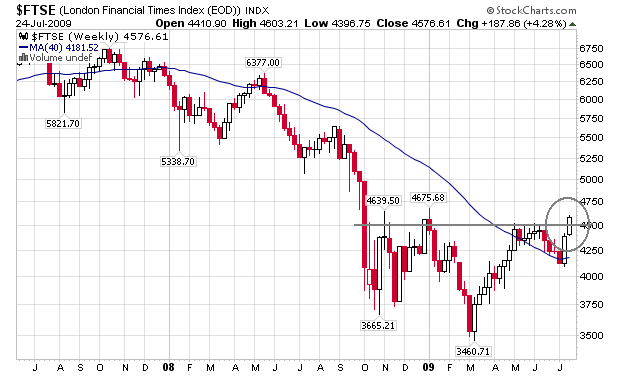
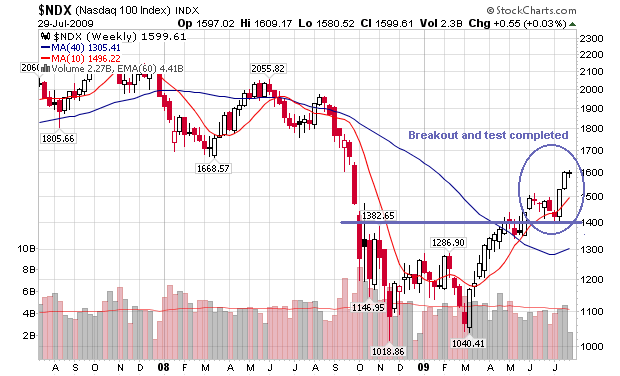
Posted July 25 - Similar patterns on
the charts of the German DAX, British Footsie,...Bullish cross-overs, key
reversals, breakouts and completed tests!
Goldonomic, Florida, USA -
 +1
(772)-905-2491
|