


Gold Targets
Sooner or later, the price of Gold will return to NORMAL...
| Gold Targets: $ 25,000 Gold ?...pick your number up to 10³¹ |
Posted October 2023

Posted August 2023.

Posted November 2022
The standard average ratio between the Dow Jones Industrials and Gold is 1:1

Posted September 2022
If you utilize the base year of 1913 to calculate a notional price of silver and gold relative to the dollars in circulation, we find that the price in 1913 for gold was $28.68 per oz. and silver $2.65 per oz. Using the same base, today's prices would be gold at $9081 per oz. and silver at $1226 per oz. This is a far cry from the market price we see right now of gold at $1700 and Silver at $19.50. A long way to catch up.
Looking at the gold-to-silver ratio, we also see a total disconnect from reality. Moving from 96.5:1 recently to a current ratio of about 86:1, a move in the right direction towards the ratio of 7:1, at which the miners are currently recovering silver to gold, indicates to me something brewing in the market. Assuming the current price of gold is around $1700.00 at a ratio of 7:1, silver would be around $250 per ounce. If it only goes back to 16:1, which was historical, it gives a price of $106 per oz.
Posted August 2022

Posted March 2022
 |
 |
Posted May 2021

Posted October 2020
 |
 |
 |
|
Posted July 2020
 |
 |
| posted July 2020 | posted March 3, 2020 |
 |
 |
| posted August 2019 |
Based on Fourier Analysis |
Gold cycles with a new record not later than 2024.
 |
 |
Elliott medium-term weekly chart with targets.

Our Point & Figures-chart price target:

Price Target as seen by Elliott Wave technicians (Aug 2018):

This is the ideal long-term gold cycle:

 |
 |
| $1620 is the TOP of the channel | Buy signal as strong as in 2000-2002 |
Gold 1965-2021: Markets move up and down in waves. We call it A-B-C-D waves. In case of an uptrend, A and C are up waves. B and D down waves (corrections). The A wave is smaller than the C wave. The Gold and silver sector is now moving from B (correction $1220 - $1180) to the most dramatic up wave C (with a top that will break the 2011 record of $1920). Timing always is a guess: Patience is bitter, but the Fruit is Sweet. The combination of both charts below (the strength of technical analysis lies in the COMBINATION of charts in figuring out the puzzle....not in looking at a chart in particular) tells us that the next major upleg for the Gold and silver sector will start in JUNE - JULY 2017.
 |
 |
| Gold 1967 - 2019 | click to enlarge: Gold 2008 - 2027 |

The gold price is likely to explode due to the sovereign debt crisis in Europe and the USA, combined with the impact of the negative real interest rates ruling in many major economies and Fractional Reserve gold. Having said this, the PAPER VALUE of gold is TOTALLY UNIMPORTANT...

Our calculated technical "Medium-Term" targets:
- There are several technical and fundamental ways to calculate the potential objectives for Gold: $ 1,460 - $ 1,650 - $ 6,000 - $ 6,221 - $8,000 - $10,000 - $15,000 - $ 25,000
- In 2006, after a total fall of 22.6%, gold took a year and four months to surpass its old high. After the 2008 meltdown, it was a year and six months later before gold hit a new record. Our recent correction more closely resembles the one in 1975-76. After a 48% drop, gold matched the old high seven months later. It took another two months to stay above it...and only a little more to reach $ 850 (+900%)
- If we take U.S. gold reserves at 252 million ounces and divide that amount into the national debt of 14 trillion, that yields a staggering amount of $53,639 per ounce. Even taking the world's official gold reserves divided into the US debt of 14 trillion, we still get $15,873 per ounce.
- Gold is going up and STAYING up. Everyone is looking for where and when the top in gold will come. Will it be Jim’s $1650 or Alf Field’s $10,000 plus before it comes back down? To put it nicely, everybody will be wrong.
 |
 |
| Gold and Full Moon | Gold and New Moon |
 |
 |
 |
 |
 |
 |
 |
 |
 |
 |
| Click to enlarge the pictures... | Click to enlarge the pictures... |
My medium-term $- Gold Point & Figure forecast (approximate technical indications)

The answer to the big Randy and volatile formation which comes of congestion area analysis is that the range represents a standoff between supply and demand, which is largely offsetting. Moreover, you and I, not to mention everyone else, can only deal with the reality that the market provides. Consequently, many who wish to sell above the range lose patience or hope and lower offers to within the range. Similarly, those who wish to buy below the range eventually raise their bids until they can clamber on board.
This dual process of lowering offers and raising bids extends the range. More significantly, it can also result in a vacuum of supply above and demand below the range. Once the supply or demand is exhausted, a breakout of often dramatic proportions can occur. In other words, an absence of sellers and continued demand will produce an upside breakout and vice versa. Once the breakout occurs, others jump on board, fuelling a self-feeding trend.
| Table as of Sep. 1, 2011 | 1980 | multiplication factor | 2011 | average multiplication factor | Normal Gold price |
| Credit market debt | $ 4 trillion | 12 | $ 52.2 trillion | ||
| SP500 | 105 | 11 | 1155 | ||
| US Federal debt | $ 0.84 trillion | 17 | $ 14.3 trillion | ||
| Gold | 800 | 2.25 | 2000 | 13 | $ 10,400 |
| Dow Jones | 10400 | 1 | $ 10,400 |
 |
 |
| note: we are experiencing the 1st sell-off and Bear Trap NOW (May-June 2013 until October 2014)! | |
- Elliott Wave forecast #1: [as usual - very complicated] Major ONE up from $256 to approximately $750 (a Fibonacci 3 times the $255 low); Major TWO down from $750 to $500 (a serious decline of 33%); Major THREE up from $500 to $2,500 (a Fibonacci 5 times the $500 low); Major FOUR down from $2,500 to $2,000 (another serious decline); Major FIVE up from $2,000 to $6,000 (also a 3 fold increase, same as ONE). [I think Prechter is completely wrong with his previsions.]
-
Projecting the past into the future: In the 1970s bull market, gold increased from a low of $35 to a peak of $850, a massive 24.3 times the low price. If the current bull market was in the same order, one could project an ultimate peak of over $6,221 ($256 x 24.3). [makes sense assuming the bottom for the Dow is 6,000]
-
$-Gold will rise until the Dow Jones and the Gold price are levels: Assuming a Dow Jones of 15,000, $-Gold will rise to $ 15,000.
-
Elliott Wave forecast #2: [as usual - very complicated] Assuming that the $699 low on 23 October 2008 turns out to be the actual low point for Major TWO, the following objectives can be calculated. Major ONE up from $256 to $1,015 (actually 4 times the $255 low); Major TWO down from $1015 to $699, say $700 (a decline of 31%); Major THREE up from $700 to $3,500 (a Fibonacci 5 times the $500 low); Major FOUR down from $3,500 to $2,500 (a 29% decline); Major FIVE up from $2,500 to $10,000 (also a 4 fold increase, same as ONE)
-
The Shadow Gold Price (Paul Brodsky & Lee Quaintance): Our "Shadow Gold Price" (SGP) gives us the nexus of a valuation metric that seems legitimate and, hopefully, profitable. We gathered monthly data on a host of variables since 1973. The graph immediately above is a 35-year time series of the spot market gold price and the SGP. As you can see, Spot Gold and the SGP tracked each other fairly closely until the early 1980s. Interestingly, the SGP begins to take off in the mid-80s and has gone to the moon in the last couple of months. Of course, this isn't terribly surprising, given the muted variances in official gold holdings and the aggressive growth in FRB balance sheet liabilities over the same period.
-
Krassimir Petrov expects that when the gold bull market peaks, the price of gold will roughly equal the Dow Jones Index. Thus, we should expect gold to outperform the Dow in the coming years about 10 to 20 times to bring that Dow-Gold ratio down to 1 to 2.
- Elliott Wave Forecast #3: [see chart below] Elliott Waves are extremely complex and subject to different interpretations. Interesting, however, is that the max. EW correction is $ 1522, which correlates with the potential maximum correction on the Point and Figures charts. However, such does not indicate we will see Gold at this low price. [Click on the chart below to enlarge]

Objective according to Shadow Stats: $ 9,500
Key levels for $-Gold are
$ 961 - $ 1024 - $ 1089 - $ 1156 - $ 1224 - $ 1300 - $ 1460 - $ 1650 - $ 1820 - $ 2380 - $3500
The same applies to Krugerrands. "There are over 55 million Krugerrands. It's really easy to buy and sell anywhere from one Krugerrand to a couple of thousand Krugerrands. It's really a very liquid market."
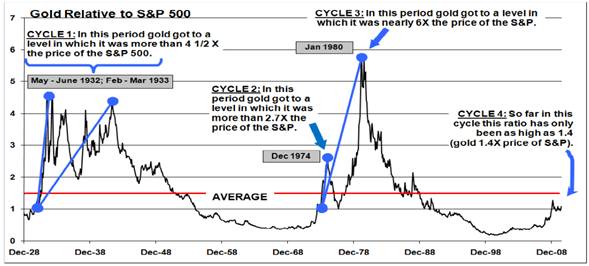
Gold price objective in terms of the Standard and Poor's Index: 8 x SPX = $ 8,000
|
The COMEX is short in Gold and Silver beyond what they can deliver. If this is true, Gold will double overnight! They dig their own grave each time they drive the price of paper, gold, and Silver down...but what else to expect from empty heads!? |
© All Rights Reserved - The contents of this report may NOT be copied, reproduced, or distributed without the explicit written consent of Goldonomic