Silver
July 26, 2024: Silver is Gold on steroids...and costs 12.5% more in China!
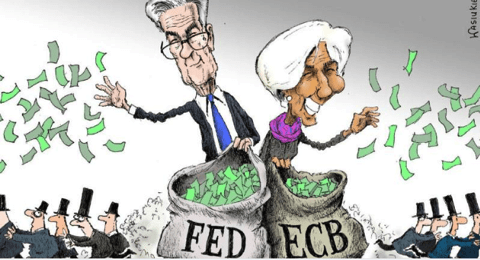
"This is the price evolution of FIAT PAPER SILVER! - Physical Silver sells at a 40% premium!"
The silver market is tiny. About 700 million oz. of silver is mined each year worldwide, about 200 million oz. is recycled, and about 100 million oz. is from "other" sources, like governments. That's the supply side. At $20/oz., this is a $20 billion annual market.
Important: this is the price evolution of FIAT-PAPER-SILVER and NOT of PHYSICAL SILVER!
 Silver-Gold ratio long-term Silver-Gold ratio long-termClick here for HISTORIC SILVER. |
|
SLV ETF strip story: BREAKOUT [SLV is an ETF & should not be bought as an investment !] -
Breakout of halfway bottom consolidation - the medium-term target is $48, and the long-term target is $ 145!
This action explains the HUGE FLAG formation: "The Chinese are divesting out of paper right now. So, we see a huge uptick in euro physical silver purchases and dollar silver purchases. When Silver took out $33, many physical orders were filled. The Chinese are doing the same thing in the silver market as in the gold market, with massive accumulation on dips. It is also important to note that the local traders in silver are short and nervous. Everyone is short silver, so the market can move violently higher when it turns. When silver reverses, it will be the one that leads the market higher."
| The Bearish Triangle is now a Bullish Flag. The formation formed at this time will propel Silver to about $ 88. That is after the $48 has been broken to the upside and tested. |
 |
 |
 |
| Strong BUY | Mind the low, explosive BB |
Strong BUY (month LT) |
| Click to enlarge. The first chart was published in 2017. All charts are very bullish. |
||
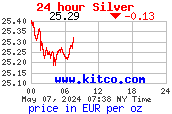
Silver expressed in Euro
| €-Silver | ||
 |
Bullish objective | € 32.00 |
| Resistance | € 28.00 |
|
| Support | € 22.00 |
|
| Bearish objective | € 14 | |
| Technical pattern | It's a new bull run. |
|
| Big Breakout + Backtest! |
||
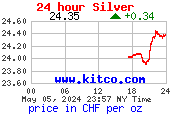
Silver expressed in Swiss Francs -
 |
Bullish Objective | FS 42 |
| Resistance | FS 32 |
|
| Support | FS 25 |
|
| Bearish Objective | FS 14 | |
| Technical pattern | Beginning of a new bull trend |
|
| Big Breakout & Backtest. | ||
Only retarded investors don't get this! Investing is NO CASINO; this information is still actual, even in 2019.
| € Silver month | CHF Silver month |
| The price goes up when time is up: Time is UP (Nov 2017 - Feb 2019) | |
 |
 |
| Strong Buy. | Strong Buy. |
A perfect technical picture we had. See the 2004 breakout out of a vast bullish triangle. In the 20 years (1985/2004), the resistance line has become colossal support. The first bull run was interrupted in 2008 when Lehman Bros collapsed, and we had a substantial deleveraging. [Whether Lehman is to be blamed or not is another chapter.]
During the deleveraging action, the BREAKOUT level was positively tested (indicating we now have a confirmed BULL TREND). After the test, silver geysers again reached the top of its long-term trend channel. Silver goes parabolic, or it needs to consolidate sideward (I think the latter will happen).
For this reason, I expect Gold to perform better this year than Silver. Silver is the poor man's gold. Silver will be strong if people are insecure, and we sit with this Fiat paper money. We have a paradigm shift: what we live in today is not the ordinary recession we lived through during previous cycles. By now, this should have become clear to most. The crisis asks for extraordinary measures and exceptional protection.
Silver is one way to ensure your savings. It is a REAL ASSET, REAL MONEY. (The alternative is to buy Government bonds that yield nothing, keep your money in Bank accounts that yield nothing, or stack it under your mattress where it will be inflated away). At this time, Silver sits in a congestion zone....the bigger the zone, the larger the subsequent run.
Updated March 15, 2010
$-Silver objective for Wave II is $ 42,50 - €-Silver objective for Wave II is € 35: Silver has finished the 1st Wave cycle 1,2,3,4,5, and the subsequent ABC correction. Logically, it will reverse and start its Wave II cycle in the wake of Gold. The objective is $ 42,50, or 5 times the low.
- April story: Silver and Gold usually put in a bottom in March and a top in April. On March 18th, we had a bottom for Gold. If one misses the March bottom, one usually has to wait for the Summer to see a fresh buying opportunity.
- Silver moving averages have now also confirmed their Golden cross.
- Gold and Silver mines are strong, indicating higher prices for Gold and Silver are to come. Several Gold and Silver stocks have broken above their 200-day moving average.
Updated December 20, 2008
Meanwhile, the “paper” silver price was recently nominally taken down from just above $20/oz. At around $13/oz., it is increasingly hard to find physical Silver at any price. And if one can find it, one has to pay as much as $4 or so over the spot, i.e., around $17/oz, on average. Such is the ludicrous result of living in an Interventional Universe.
Manipulation?... The least one can say is that this is a weird happening.
Last week, widely regarded silver analyst Ted Butler reported on recent developments during the July 1 – August 5, 2008 time period in the precious metals complex [specifically, open-interest data in COMEX futures].
Butler’s work shows that as of July 1, 2008, two U.S. banks were short 6,199 contracts of COMEX silver (30,995,000 ounces). As of August 5, 2008, two U.S. banks were short 33,805 contracts of COMEX silver (169,025,000 ounces), an increase of more than five-fold. This is the most significant position by U.S. banks I can ever find in the data. Between July 14 and August 15, the price of COMEX silver declined from a peak high of $19.55 (basis September) to a low of $12.22 for a decline of 38%.
For gold, 3 U.S. banks held a short position of 7,787 contracts (778,700 ounces) in July and 86,398 contracts (8,639,800 ounces) in August, an eleven-fold increase and coinciding with a gold price decline of more than $150 per ounce. As with silver, this is the most significant short position ever held by US banks in the data listed on the C FTC’s site. Click here for more.
Updated November 20, 2008 - Time to buy silver!
€ Silver bar monthly & daily charts-: Will the Central banks really convince the Herd that it is better to keep Paper Fiat Money and Government bonds instead of Real Money? Do the markets erroneously think we are going for a cycle of DEFLATION? Or is this a bear trap and an abnormal shakeout of the Bulls? Again, with the actual fundamentals, I cannot imagine we have entered a Bear Market cycle. The daily bar chart shows a nice reversal. Time to buy!
© - The contents of this report may NOT be copied, reproduced, or distributed without the explicit written consent of Goldonomic


